City is born as a system that acquires energy from the environment while increasing its complexity to gradually decay in a process of loss of energy and increase entropy until its disappearance, oscillating between growth potential related to life quality and reception capacity related to limited resources.
Entropy and Enthalpy mathematical analysis applies the New European Bauhaus principles to Territorial and Urban Dynamic System, calculating the probability of its sustainability in addition to predicting the moment in which the city shows degradation signs, abandonment and death, as Jane Jacobs named, filling a scientific gap in urban rights planning matter through integration of syntax and spatial semantics.
I Urban Dynamic.
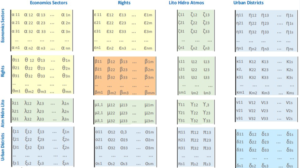
The economic, social, environmental and spatial urban flows are represented by 16 matrices
Matrices α,β,γ,δ represents monopartite internal flows relationship of each one economic, social, environmental and spatial vectors.
Rest of the matrices represents exchange bipartite flows between these 4 vectors.
- Social efficiency.
β matrix is the System Core which represents the social vulnerability level of Right to the City, as housing, health, education and others, introducing spatial semantics to spatial syntax.
Correction of rights vulnerability indicated in β matrix causes a positive troubled effect on the entire System.
α matrix is the Local Leontiev matrix which represents production interchange between the economics activities, adjusted to municipal employment.
ε matrix is the Inverse Leontiev matrix which represents the impact of rights correction vulnerability on the local economy.
θ matrix represents employment vulnerability.
- Efficiency & environmental taxation.
Poor environmental efficiency causes a decrease in environmental resources which must be compensated.
γ matrix represents material flows between lithosphere, hydrosphere and atmosphere
ζ matrix represents the environmental economic activity efficiency over the lithosphere, hydrosphere and atmosphere.
ι represent right to vegetation, water and sustainable energy.
μ matrix represent the environmental vulnerability
λ matrix represent the compensation for the decrease in resources by environmental inefficiency, obtained from μ matrix multiplied by matrix monetization
- Semantic Space.
Geolocated graphic representation allows the application of spatial patterns analysis tools, as Moran’s I, density, connectivity, accessibility, as well as different graph algorithms theory.
δ matrix represents elements flows between different census units
η,κ,ν matrices represent cartography of economic activities, dwellings and resources
ξ,ο,π matrices reveal vulnerability of economic, social and environmental vectors in census units.
II City Potential growth and Reception capacity.
The mathematical urban flows analysis between 4 vectors is completed with an identification of city potential growth related to life quality, which depends on N Population, K Quality Life, V growth of Quality Life and ε productivity and ꙍ 1,2 calculation coefficients and the City Reception capacity related to the available resources R
Potential City Growth logK=ꙍ1V+ꙍ2logN logN=ꙍ1ε+ꙍ2logK
Urban Reception Capacity lim┬(Ri→0)〖Ri/(ri Ni,t)〗=1
III Urban thermodynamics
Entropy S evaluates the capacity for social sustainability by measuring the probability of productivity dependence between social groups.
In an urban system with constant energy U, where εi is the productivity of each social group that has n i citizens, Urban Entropy S
S=γ L N!/n1!n2!
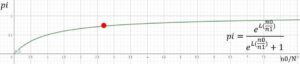
Furthermore, the probability of occurrence of a population state depends on β, which is the inverse of the quality of life K, and the homogenization coefficient of the census units γ and is also proportional directly to productivity ε of group i.
ni/N=pi=( e^(-βεi))/(e^(-βεi)+1)
Non-dependent Population n1 has ε1 productivity and dependent population n0 has ε0 productivity same zero
Then, “death of the city” occurs when dependent population exceeds 0.37 times the non-dependent population
n0/n1=e^(-1)
Territorial and Urban Dynamic System enthalpy H has an energy exchange capacity with the environment directly proportional to quality of life K and entropy S. But population density d has a negative sign.in a isotropic surface γ=1
H=K (S−2d)
This conclusion has an impact related to city compactness.
Density factor penalizes the enthalpy when the city swells and reduces it doubly when the city compacts. It´s quite intuitive to see that the soil consumption, the lithosphere factor, is greater in the sponge city.
The right to the city and the common good aims to open a window for artificial intelligence urban planning
This work is aimed to the principle formulated by Aristotle in Politics.
“Any polis which is truly so called, and is not merely one in name, must devote itself to the end of encouraging goodnes»
Napoli. April 22, 2024